we have grouped populations according to their classical social status—Brahmins, Kshatriya, Vaishya (Goswami and Shah) and Shudra (Arya and Tamta). Interestingly, the maternal structure of this region was in congruent with the classical social system, where distance from Brahmins to other groups was following a social ladder type structure . However, the male line of descent did not reveal any kind of such local structure. Notably, the distance from Brahmins to Vaishya was significantly higher than Brahmins to Shudra (t-test P<0.001). Moreover, Arya (Shudra) was closest to Brahmins and Kshatriya than to any other non-Brahmin and Kshatriya populations. The affinity of Arya towards Brahmins and Kshatriya is due to the analogous high frequency of haplogroups R1a1a-M17 and R2a-M124.

A similar observation was reported elsewhere, however, the most parsimonious reason given for such discrepancy is highly unlikely in our case giving out the closer paternal ancestry of Shudra (Arya) with the Brahmin and Kshatriya
from https://www.nature.com/articles/jhg2015121
our data showed significant (unpaired t-test P<0.0001) higher proportion of West Eurasian-specific lineages among traditionally higher caste (Brahmin and Kshatriya) populations for maternal lineages, although it was non-significant for the paternal ancestry (unpaired t-test P=0.5468).
Four Y chromosome haplogroups were the major predictors of the principal component analysis structure. East Eurasian-specific haplogroups (for example, O2a1-M95 and O3a2c1-M134) were responsible for their affinity with East/Southeast Asia, whereas haplogroups R1a1a-M17 and R2a-M124 were playing antagonistic roles. The substantial presence of Y chromosomal haplogroup Q-P36.2 also links them with the Central Asian populations. In turn, the West Eurasian-specific lineages show substantial elevation than observed in the state of Uttar Pradesh.
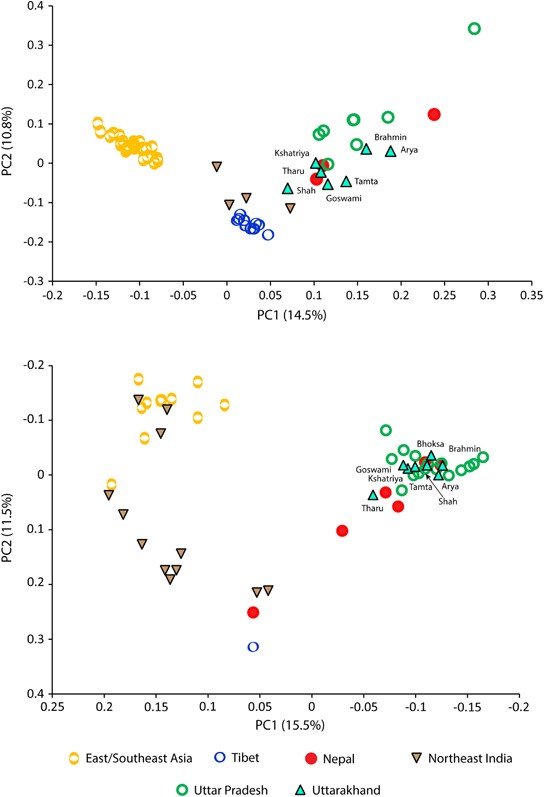
Principal component analysis (PCA) plots constructed on the basis of mtDNA (upper panel) and Y chromosome (lower panel) haplogroup frequencies. Data from neighboring regions are compiled from published sources (given in Materials and methods section).


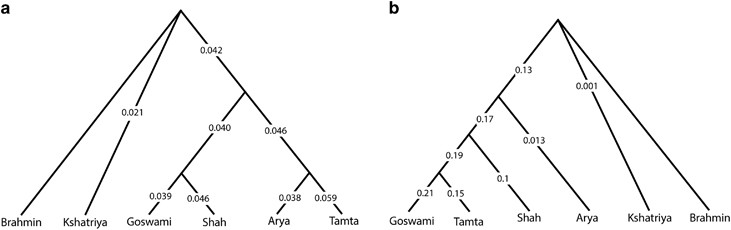
The genetic distance of each population and population groups based on mtDNA (a) and Y chromosome (b) data. As Brahmins were attaining outlier position, all the distances were shown with respect to the Brahmins.

In the present study, from the NJ tree, the genetic affinity of five tribal populations of Uttarakhand were found in two clusters of populations—in one cluster, Buxa, Jaunsari, Tharu and Bhotia were found and in another, alone Raji was found. Further, from the MDS plot between Buxa, Jaunsari, Tharu and Bhotia, Buxa–Jaunsari and Tharu–Bhotia were found to have a close genetic affinity and again Raji was found distinct from other populations. The present genetic study results were correlated with the earlier study of cultural diversity and it was emphasised that except Raji’s, the rest of four scheduled tribe bear a long history of cultural contact. Certain sections of Bhotia and Buxa have imbibed many cultural traits of upper caste Hindus. Instances of similar influence are reported from upper social categories of Jaunsaries (Mann & Mann, 1999). Another study has mentioned that physical appearance of Rajis exhibit mixed physical traits of Aryans, Dravidians and Mongoloids. They are of whitish complexion, of average height, have straight and scanty hair of slight brownish colour, intermediate headed type with medium nose, round to long face and small eyes with grey pigments (Rastogi, 2015). This explains the present study’s findings from the NJ tree and also from the MDS plot that Raji’s genetic profile was distinct from other studied populations in Uttarakhand. Except Raji, the genomic affinities by the MDS plot correlate well with their geographic affiliation, Tharu and Bhotia confined to the Kumaun region and Buxa and Jaunsari confined to the Garhwal region of Uttarakhand.
The result of the present study showed that Raji and Buxa scheduled tribal (ST) communities were the ancestral populations among five studied populations. However, our findings were correlating with Ministry of Tribal Affairs Statistical Report 2013, which stated, across India out of 75 Particularly Vulnerable Tribal Groups (PVTG’s), Raji and Buxa ST communities were one among them due to their socioeconomic backwardness and living still in primitive conditions. A few decades back, a researcher opined, ‘Ragi’s are one of the very few tribal communities still inhabiting the caves and rock shelters’ (Bora, 1988). Regarding origin, the Rajis were descendants of prehistoric Kiratas, who were comparatively early settlers of this region than the Nagas and Khasas (Rastogi, 2015). Kiratas were the first to arrive India, in course of time, they were uprooted and their few descendants remained in Kumaun and Nepal (Atkinson, 1973). Presently, Raji’s are found both in India and Nepal, the frequency of Raji population was found more in Nepal than in India (Bisht & Bankoti, 2004). Raji population was included in Tibeto-Burman linguistic family but originally Raji language was a paleo-linguistic relic of Munda dialect, which can be classified under the Austro-Asiatic linguistic family.


