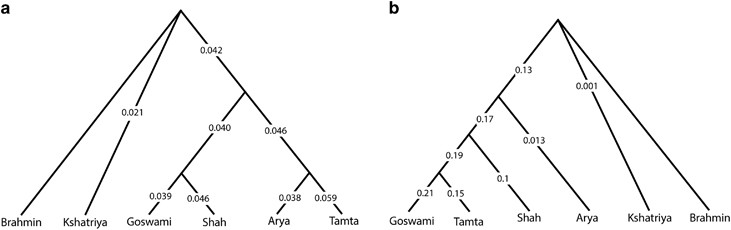
Neighbour-joining tree of 21 Tamil Nadu ethnic groups. Nomenclature of the NJ tree, A and B, ancestral and derived node; C and D, branch; C1, C2 and D1, subbranch; C1a, C1b, C2a and D1a, clade; C1a1, C1b1, C1b2, C2a1 and D1a1, subclade; C1a1.1, C1b1.1, C1b2.1 and D1b1.1, cluster; C1a1.11, subcluster.
There are many Vellala branches from http://tamilelibrary.org/articoli-352.html
Mudaliars, Pillais and Gounders have a common ancestry which many people are not aware of. All the three so called caste names were originally titles held by chieftains. These three groups actually belong to the Vellalar community, who were agricultural landlords and inhabitants of the "marutha nilam" (one of the five lands advocated by the Sangam literature). It is said that pure Tamilians should be able to trace their origin to any one of the five lands. The "marutham" (cropland) was inhabited mainly by two groups, the Vellalas (agricultural landlords) and the Pallars (agricultural peasants). This land was very fertile with lots of fields. In an ancient Tamil poem, “mukkudal pallu” (முக்கூடற் பள்ளு), murthapalli (elder Pallar women), illayapalli (younger Pallar women) and "pallan" (their Pallar husbands) make fun of the Vellalar landlord.
Later, during cultural diversification, the Vellalars started diverging into small groups, depending upon the regions of Tamil Nadu that they inhabited. Thus, those of the Thondaimandalam became the Thondaimandala vellals (Mudaliars and few Pillais). This area includes the present day areas of Chennai, Chengalpet, Kanchipuram, Vellore, Cadalore, Arcot, Vadalore, and Thrivannamalai. In these areas, the Vella Mudaliars (also called Arcot Mudaliars) are the dominant community.
Those who inhabited the areas of Chola (Thichy, Thanjavur, and Pudukottai) and Pandiya mandalams (Madurai, Thirunelvelli, Thuthukudi, Kanyakumari, and Nagerkovil) became the Shoziya Vellar (or "Chola Velar") and Pandiya Vellar respectively. Both these communities have Pillai as their surnames.
The Vellalas of the Kongu mandalam were called as Kongu Vellalas (Gounders or Kounders). This area includes Coimbatore, Salem, Pollaichi, Udagamandalam and Darmapuri, where the Kongu Vella Gounders are the dominant community. Its also said that the Pillai, Menon and Nair communities of Kerala also belong to the Vellalar community (the so called Chera Cellals).
Even though 90% of the Tamilian Vellalas have Pillai, Mudaliar or Gounder surnames, it should be remembered that not all Mudaliars, Pillais and Gounders are Vellalas. The vice versa is also true — thus sometimes some Vellalas have other surnames like Chettiar, Nayakar, and so on. Similarly the Adamudaiya Mudaliars and Senguntha Mudaliars (who form a significant number among the thondaimandala mudaliars) are, strictly speaking, non-vellals. The Adamudayars actually belong to the Mukkulathor community, which also includes the Kallars and Maravars. These three communities (as the name "Mukkulathor" — meaning three communities — have Devar has their surname. But latter the Agamudaiyars (the most upward community among the three) slowly migrated towards the northern part of Tamil Nadu, settled there, changed their surname to Mudaliar and mingled with the local Vellala Mudaliars. Similarly, the Senkunthars, who belong to the weaver community and form a significant population in Kancheepuram and Tirupur-Salem, started using Mudaliar surname for social upliftment, and started marrying with the Vella Mudaliars.
Today the caste “Thuluva Vella” includes the Vella Mudaliars, Agamudaiya Mudaliars and Senkuntha Mudaliars. Even today inter-marriage between the Vella Mudaliars and non-Vellala Mudaliars is not accepted in very orthodox families. A small but significant population of Mudaliars also exist in areas other than the Thondaimandalam, such as Madurai, Tirunelvelli, Coimbatore, etc. However, most of them are actually migrants from Thodaimandalam area.
Among the Coimbathore Gounders (even though the word generally refers to the Kongu Vallala Gounders), other non-Vella Gounder also exist including the “Vettuva Gounders” or “Vanniya Gounders”. Even though both the Vellala Gounders and Vanniya Gounders share the same surnames, they belong to a totally different communities, and marriage between these two communities is forbidden by both of them. In general, among all the vellalas, the Kongu Vellalas are unique and follow totally different customs and traditions. Endogamy is very strong among their community, and they strongly believe in the purity of their genes. They have a unique social organization called “kootam” which the equivalent of the bhraminical “gothram”. Thus persons belonging to the same “kootam” are considered as brothers and sisters, and marriage between them is forbidden. Some of the Vella Gounders were also rulers and thus are considered as Kshatriyas. Their marriages are held by senior members of their family and not by Brahmins. Their temples also have Vella Gounder priests, unlike other temples which have Brahmin priests. Thus most occupations in their society is managed by members of their own community, except for jobs with low social status.
Of the three Vellala communities, the Pillais are the most exogamous. Thus in many parts of Tamil Nadu, there are many people belonging to diverse communities wh ocall themselves as Pillais — again for obvious social upliftment. Thus, the sub-caste system among Pillais is very diverse. Even among the Vella Pillais, eight major groups can be identified: 1. the Karuneega Pillai (Kanaku Pillai mainly in Thondai mandalam area), 2. Karkattha Pillai (Thanjavur kumbakonam area — many people belonging to this community are wrongly mistaken as Brahmins due to the strong association between these two communities in the Cauvery belt area), 3. Thuluva Vella Pillai, 4. Shoziya Vella Pillai, 5. Pandiya Vella Pillai, 7. Thirunelvelli Siva Pillai, 7. Nanjil Pillai (Sengottai Pillaimar) and 8. kKerala Pillai (Chera Vellalar).
Since there are so many sub-castes, hierarchy among them is inevitable. Even though the Thirunelvelli Siva Pillais are Vella Pillais who belong to the Pandiya mandalam, they tend to differentiate themselves from the non-vegetarian Pandiya Pillais and claim supremacy. Similarly, even though the Shoziya Vellals and Karkathars both inhabit Chola mandalam and share their Pillai surnames, the vegetarian Karkathars claim supremacy over the non–vegetarian Shoziya Vellas.
Interestingly, the Thodaimandala Saiva Mudailars, Thanjavur (kumbakonam) Karkathars and Tirunelvelli Siva Pillai — though belonging to three different mandalam — tend to flock together due to common food habits (strict vegetarians) and traditions (most of them are Shaivites), and inter-marriage among them is sometimes acceptable. Each group claims supremacy over the others in terms of genetic purity, which is analogous to the fight between the “Vadakalai” and “Thenkalai” Iyengars.
Even though strictly speaking, these communities are minorities, they claim supremacy over other Pillais, Mudaliars and Gounders. Among the Pillais, the most isolated group is the Nanjil Pillais. They inhabit the Kumari mavattam (Nagerkovil and Kanyakumari). The other Tamil Pillais don’t marry with them, since these people are strongly influenced by the Kerala culture. The Nagerkovil Kanyakumari area is located on the tip of Kerala and Tamil Nadu; it was once part of Kerala and is now in Tamil Nadu). The strong Kerala influence is seen in there food habits, language (slang) and other customs which sort of differentiate them from the other Tamil Pillai communities. But since this community is of Tamilian origin, marriage with the Kerala Nairs, Menons and Pillais is prohibited. Thus the Vellala community of Tamil Nadu (and perhaps Kerala) even though has a long heritage which can be traced back to Sangam literature is largely diverse and much unknown to the modern world.
The Tuluva and Kongu vellalar are probably the new groups that came in during the Kalabhra invasion. During this Kalabhra invasion some of the newer groups won over the Sangam kings and settled down. Then there was resurgence of existing Vellalas to make the lands of these new comers into public which led to further fights. These events are documented in Sangam literature. The Neighbourhood joining tree shows that the Kongu and Tuluva vellalars have affinity towards Telugu groups. The Veerkodi vellala seem to cluster with Maravar and the Agamudiya Vellala with Vanniars and Yadavars. Some older Vellala groups have high J2a and some L1 haplogroups.
As seen in the diagram below, main migrations would be
- Ancient C migration 70-60k ybp most of who perished in Toba eruption. very few Kallars seem to carry it
- H1 hunter gatherer groups in Karnataka and Kerala who are Kurumba
- J2a Neolithic farmers present in Toda and Vellala
- R2a migration during late IA from Utkal/Vanga present among Maravar, Kallar, Sinhalese etc..
- Gujjar H1, G etc.. found among Nadars
- H1, R1a found among Yadavar
- H1, R1a found among Iyers
- L1 found among Vellala and some other groups
- F, H, O present among Kongu Vellalas migration with Kalabhras
- J2b found among some Vellalas from Andhra and some Yadavar. J2b groups are found among Andhra & Kannad castes like Balija, Lingayat and some tribals like Asur and nadikuruvar etc...